Saturday, October 26, 2024

The YIELD Curve has UN-inverted, many other countries are pushing away from the USA / USA (see the BRICS alliance), now what?

Well, it has been a few months since I have written, and I'm not sure the world economic situation has gotten better. I can say that it has CHANGED, though not totally for the better.

What Signposts Can We See?

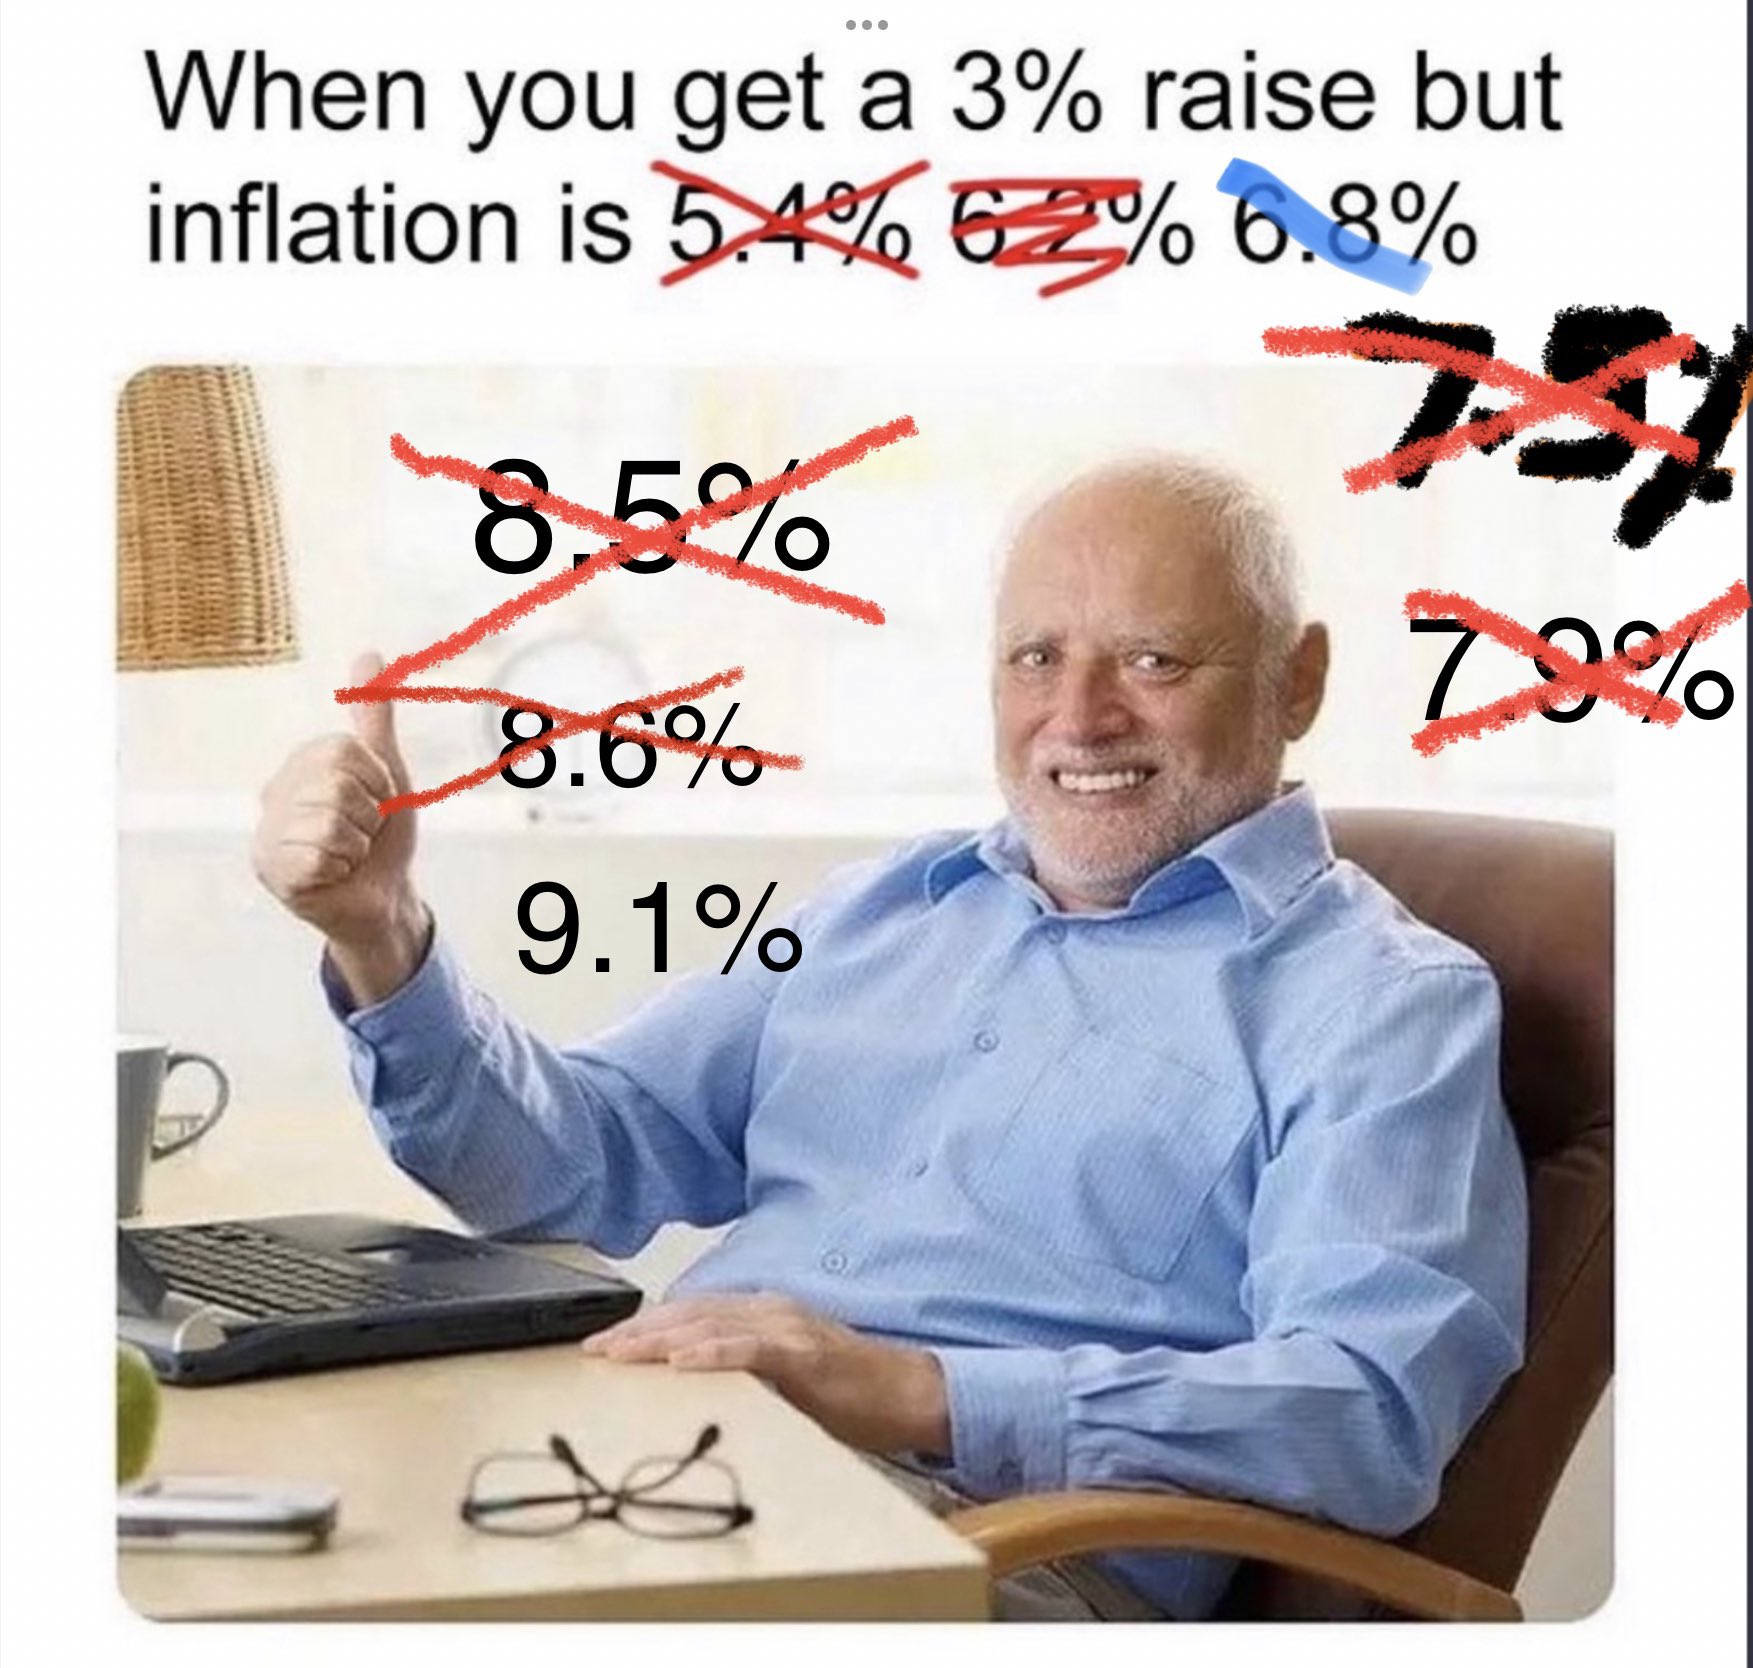
Inflation has moderated, but standards of living continue to be hurt because in general, pay rises, except apparently at the lowest income cohorts, have NOT risen to match the inflation of prices seen. (and the way they measure inflation is actually considered bogus my many because of the many manipulative calculations used like "substitution", hedonics" and things like using "Owners Equivalent Rent" as opposed to real measures of rent or home prices.)


World Stresses:
But the world has other stresses now too.....the stress of war is growing stronger, as well as the stresses created by the sanctions and weaponization of the world reserve currency because of war. (which was a problem for decades actually with other countries the USA did not like.....but the world reserve currency is a bit like "air", very important....and something that most thing should NOT be trifled with)

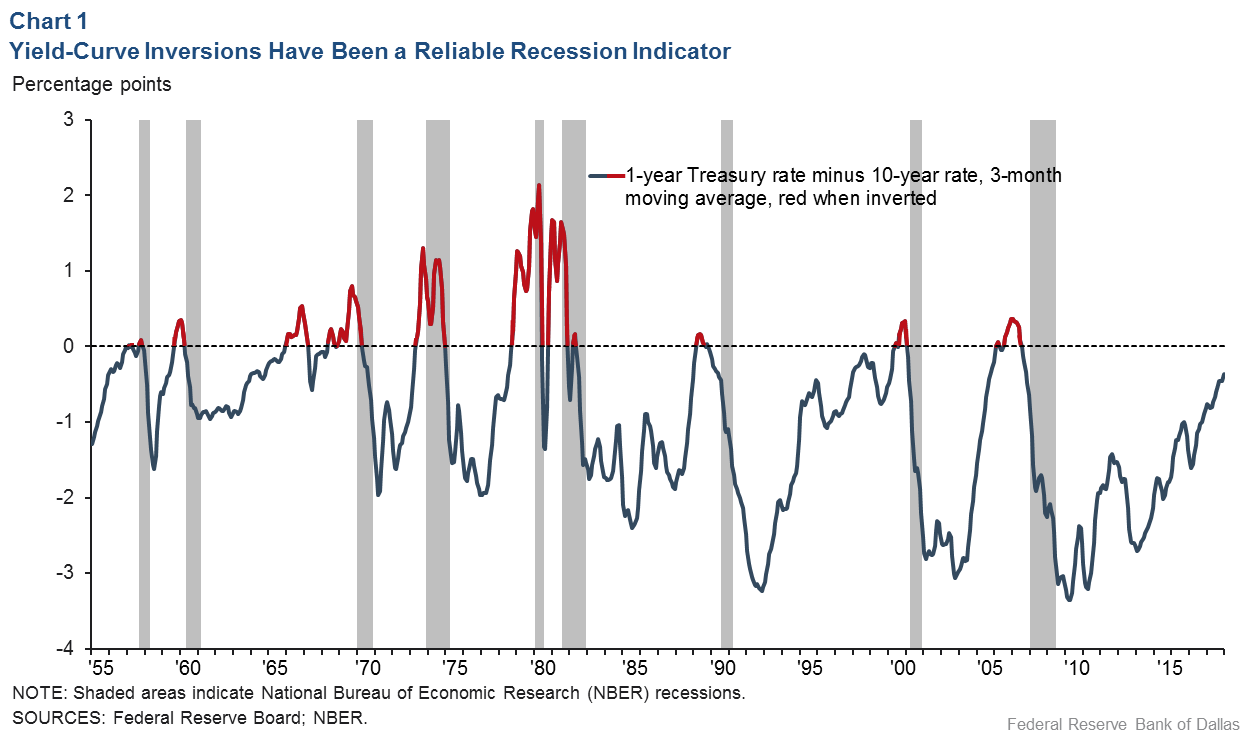
The yield curve has UN-inverted, after being inverted for a VERY LONG TIME.....and I have been told that recessions are signaled by the inversion of the yield curve, but only start after the yield curve UN-inverts!


 Where are the Anti-WAR people?

War is all around.....and no one seems to be pushing for peace?!? Some conspiracy types suggest that if the global economy trips up again, a war is the sort of thing that can not just create a distraction, but the sort of event that "resets" or "recalibrates" global power. (your beliefs may be different.....) I just ask you to dig down deep if you are supportive of the escalation of the world conflicts.....how has it worked out so far? Have any of the USA wars over the past two decades resolved ANYTHING? (they certainly killed a lot of people and created millions of refuges fleeing their homeland)


Canary In The Coal Mine?

Gold.....perhaps the canary in the coal mine? Well, that's what a lot of people are thinking.....central banks are buying it now. The BRICS alliance is talking about using as a reserve asset for their settlement currency (up to 40% backed by gold?)


What Happens Next? 

Now what.....I guess if you believe in Game Theory, no one wants any sort of disorderly transition....but we can SEE there are stresses and unhappiness with the status quo....so what are these stresses?

Here are my thoughts.....the USA is trying to "run the world"....and when things don't go our way, we use our weight to make it so.....we do so militarily, and we do so with out money. (Which happens to be the world reserve currency)

Well, you can see what others might not be so happy with that.....in fact, the USA is able to PRINT GREEN PIECES OF PAPER without limit, and so trade those for goods and services that other people of the world actually toil to create. (you can see how our debt that skyrocketed as of late, with little ramification)


What do you and I do?
I have no clue.....I don't things will get better until we become productive....but how things will devolved, I don't know, except to say I thing our standard of living will continue to slowly drop.....but for what reason, inflation or deflation, I'm not sure.

Cash flow is king.....real assets will be good at times....productive activities will be very valuable at times too. (but be ready for heavy taxation.....I fear we are looking at a "redistribution" future where our population will demand a "Robin Hood" redistributive government.....be be prepared. (at least mentally)


Tuesday, February 27, 2024

Keeping an eye on Michael Kantro's HOPE framework

 The HOPE framework is the creation of Micheal Kantro, CIO of Piper Sandler. Michael’s HOPE model looks at Housing, New Orders (ISM), Corporate Profits, and Employment and according to his back testing, the economy doesn't fall into recession until all four of these metrics peak and fall off.


Well, it isn't yet dramatic, but I have a few friends who have recently been laid off, and I think we can see some of the companies in the US shedding employees. I think those numbers will start increasing in the reports for Feb.....but even the last report showed a recent increase.


We shall see how things progress, and whether Michael Kantro's HOPE framework has real predictive power.

Saturday, September 17, 2022

Will US GDP Grow This Quarter? (if not, will this be called a recession???)


HOW IS OUR ECONOMY DOING, AND WHERE IS IT TAKING US?

Most of my friends probably don't think it really matters whether they know how our economy is doing or where it is going because it is "out of their control".....and I agree, but only to a point.

It is clearly outside our individual control, but like a sailor measuring the wind direction and speed, knowing the economy and its direction is very important to all of us interested in navigating our future. (in so far as how much any of us actually navigate and don't just float along like a log)


HOW DO WE MEASURE THE ECONOMIC WINDS?

Well, there is an obvious first order way that is available to most everyone who controls their own finances.....that is just their own personal / family budgets. I mean how much each of us gets for income and then in expenses and how that affects our discretionary spending. (or how much we can save) IMHO, that is a lagging indicator....I mean this is not at all forward looking, and everything that made this situation occurred happened at some point in the past....setting our sails based on past history is not very useful.....the only use it is to us is to show us is whether we ARE -or- ARE NOT going in the direction we desire. (As a first order approximation, that might be be enough to kick us into action, but in terms of defining the action to do what, I don't think there is enough information)


WHAT OTHER METRICS THEN?

Well, the next thing we have to decide might be whether the general macro environment is getting better or worst....whether there is overall expansion or contraction. That is actually quite important because the notion that a rising tide lifts all boats is a truth.....and knowledge of this simple idea will help us better appreciate whether we might want to think more about next moves for opportunity or defense. (One can and should still look for both, but knowing general overall conditions might allow us to know more about how "everyone else" might be moving.....where the opportunity / dangers might be)

I suppose most folks will take to the news media for their first measure. I warn folks right up front that as we look for ways to measure things, we try to understand the incentives those giving us that data might have...."what's in it for them".....or perhaps "follow the money". That is not to imply that they will lie so much as at times lay their "thumb" on their measuring scale and allow their analysis to drift in the direction that benefits them. We all know this as being obvious when we think about the modern term "click bait".....which is not so new really when you think of the fantastic headlines we have seen in the years growing up on the headlines of the National Enquirer as we were in the store checkout lines.

 Now this isn't to say we can't trust our media....mainstream or otherwise, just that we have to realize that once they go beyond just reporting a particular number or statistic and then go on to "explain" that it means, they are moving into the arena where their own judgement and prejudices are going to work. (ditto for us too.....it is a human thing)

THE NEXT UP, OFFICIAL STATISTICS KEEPERS

The next step beyond personal intelligence is probably intelligence of close friends and associates. It makes sense to "ask around" and take the temperature of those around us....and knowing them only allows our BS detectors to work more perfectly since we can measure the information they provide better.

But beyond that, there are plenty of other places to look for data.....some are more useful and accurate than others...and of course, NONE are going to assess black swan events.....but that is another thing all together, and IMHO, something we should consider, but isn't covered here.

--> NH STATE DATA

States often have official organizations that look over the state and keep track of lots of statistics and metrics that I suppose elected leaders of the state would use to appreciate the conditions for future legislation and impacts of past legislation. But the date these state organizations roll up can be very useful to us too. 

--> FEDERAL RESERVE NATIONAL PROGNOSTICATION

The US Government has no shortage of bodies working on measurement and predictive analysis. One such organization is technically a private organization / business, the Federal Reserve. It is a particularly important entity because is in charge of the countries money supply, and since the US Dollar is the median of exchange here, it is always one of the "products" used in every single non-barter exchange made.....so the "price of money" is key to all our economic lives. 

As I understand it, it must be noted that the GDP Now forecast is one that starts a quarter with projections based on models and projections and which is then continuously honed as the quarter goes on with real date coming in.....so the number changes over time as the quarter progresses. As of late, the estimate number has started out high at the start of the last two quarters and was then ratcheted down as those quarters progressed. 

--> THE CONFERENCE BOARD LEI (Leading Economic Index)

The Conference Board, Inc. is a 501(c)(3) non-profit business membership and research group organization. To me is seems like a global Chamber of Commerce of sorts.

Their interests go far beyond economics, and I'm not passing judgement on any of these, only pointing out that they do produce what they suggest is a forward looking predictive analysis that is considered by many for its predictions, their set of Leading Economic Indicators.


--> THE STOCK MARKET AS AN INDICATOR

Stock and Bond (and I suppose currency) markets are known to be leading economic indicators of sorts. Depending upon up much you believe in the efficient market theory, you can consider these markets as "bets" that many millions of people are making about the future of particular businesses, industries or sectors. I believe one of the Conference Boards LEI measures is in fact these markets.

One can of course just look at the general market price rises and falls as an indication of health, and this is probably valid if you consider it also takes into account a heavy dose of emotion and sentiment in the short term. They old saying is: “In the short run, the market is a voting machine but in the long run it is a weighing machine.” That doesn't mean the data is useless....in fact, if you think of it, this actually "adds" very important information to that way of measuring!

Here is another way to use stock market price flows....by looking under the surface of just the broader number and at which "sectors" are doing better or worst than others.....otherwise known as sector rotation. Just like the saying above, it has information as a short term and longer term measure....and is probably a bit like reading tea leaves in that you need to "understand" what that means. (probably done by looking at others measures and triangulating to an opinion) 

  • Here is a link that lets you look at prices various ETFs that invest in different companies in different sectors of the economy.....but you can create your own "mix" of stocks or FUNDS to cut across the companies or markets in any way you might find useful. (even across sectors across countries.....etc...) (you can also easily use this to look back at the visual history of any relationships you find interesting in the past and maybe correlate them with events happening back in that time....to perhaps test some theory / idea / relationship you might think exists)https://stockcharts.com/freecharts/perf.php?XRT%2CXLF%2CXLE%2CXLU%2CXLK%2CIYT%2CGDX%2CXLI%2CXLP%2CIYR   
  • There are of course other companies that give your ways to create your own "charts" that allow a look back at history and which of course might also have predictive value. Here is one FREE site that allows you to cut across data all sorts of ways: https://stockcharts.com/freecharts/ (of course many of the FREE looks are there to wet your appetite so you might "pay" to get your own particular stocks....but the FREE view still offers good insights. Here is an example: https://stockcharts.com/freecharts/rrg/ )


INFLATION (Growth Compared To What?)

The next important aspect of all of this is defining what I think of as the denominator in the equation.....we can look for say investment growth, but what is most important is purchasing power or growth above the level of inflation. Many of the above measuring systems do NOT take this account.....directly or indirectly.

If we want to actually measure progress, we need to consider inflation. Here are a few places that measure and predict inflation, otherwise known as devaluation of currency. (lessening of purchasing power of a currency)

Here are a few sites that give us insights into inflation and growth, in the USA and the world.

WHAT TO DO WITH ALL THIS DATA?!?

That is up to you! We each need to formulate our own questions and search for the answers. I for one think that not only are there BLACK SWAN events that come about, but there are also big blind spots in the data we use....and then of course our own interpretations.....so I suppose I am a bit conservative and rist averse.....so I suggest diversification and never going "ALL IN" on any idea.

Wednesday, September 14, 2022

DON'T BUY THE DIP, BUY THE TRAIN WRECK!

 - OR .....WHICH IS STRONGER, STAGFLATION OR YOUR STOMACH


Today I heard someone say the title I used here....."DON'T BUY THE DIP, BUY THE TRAIN WRECK".....

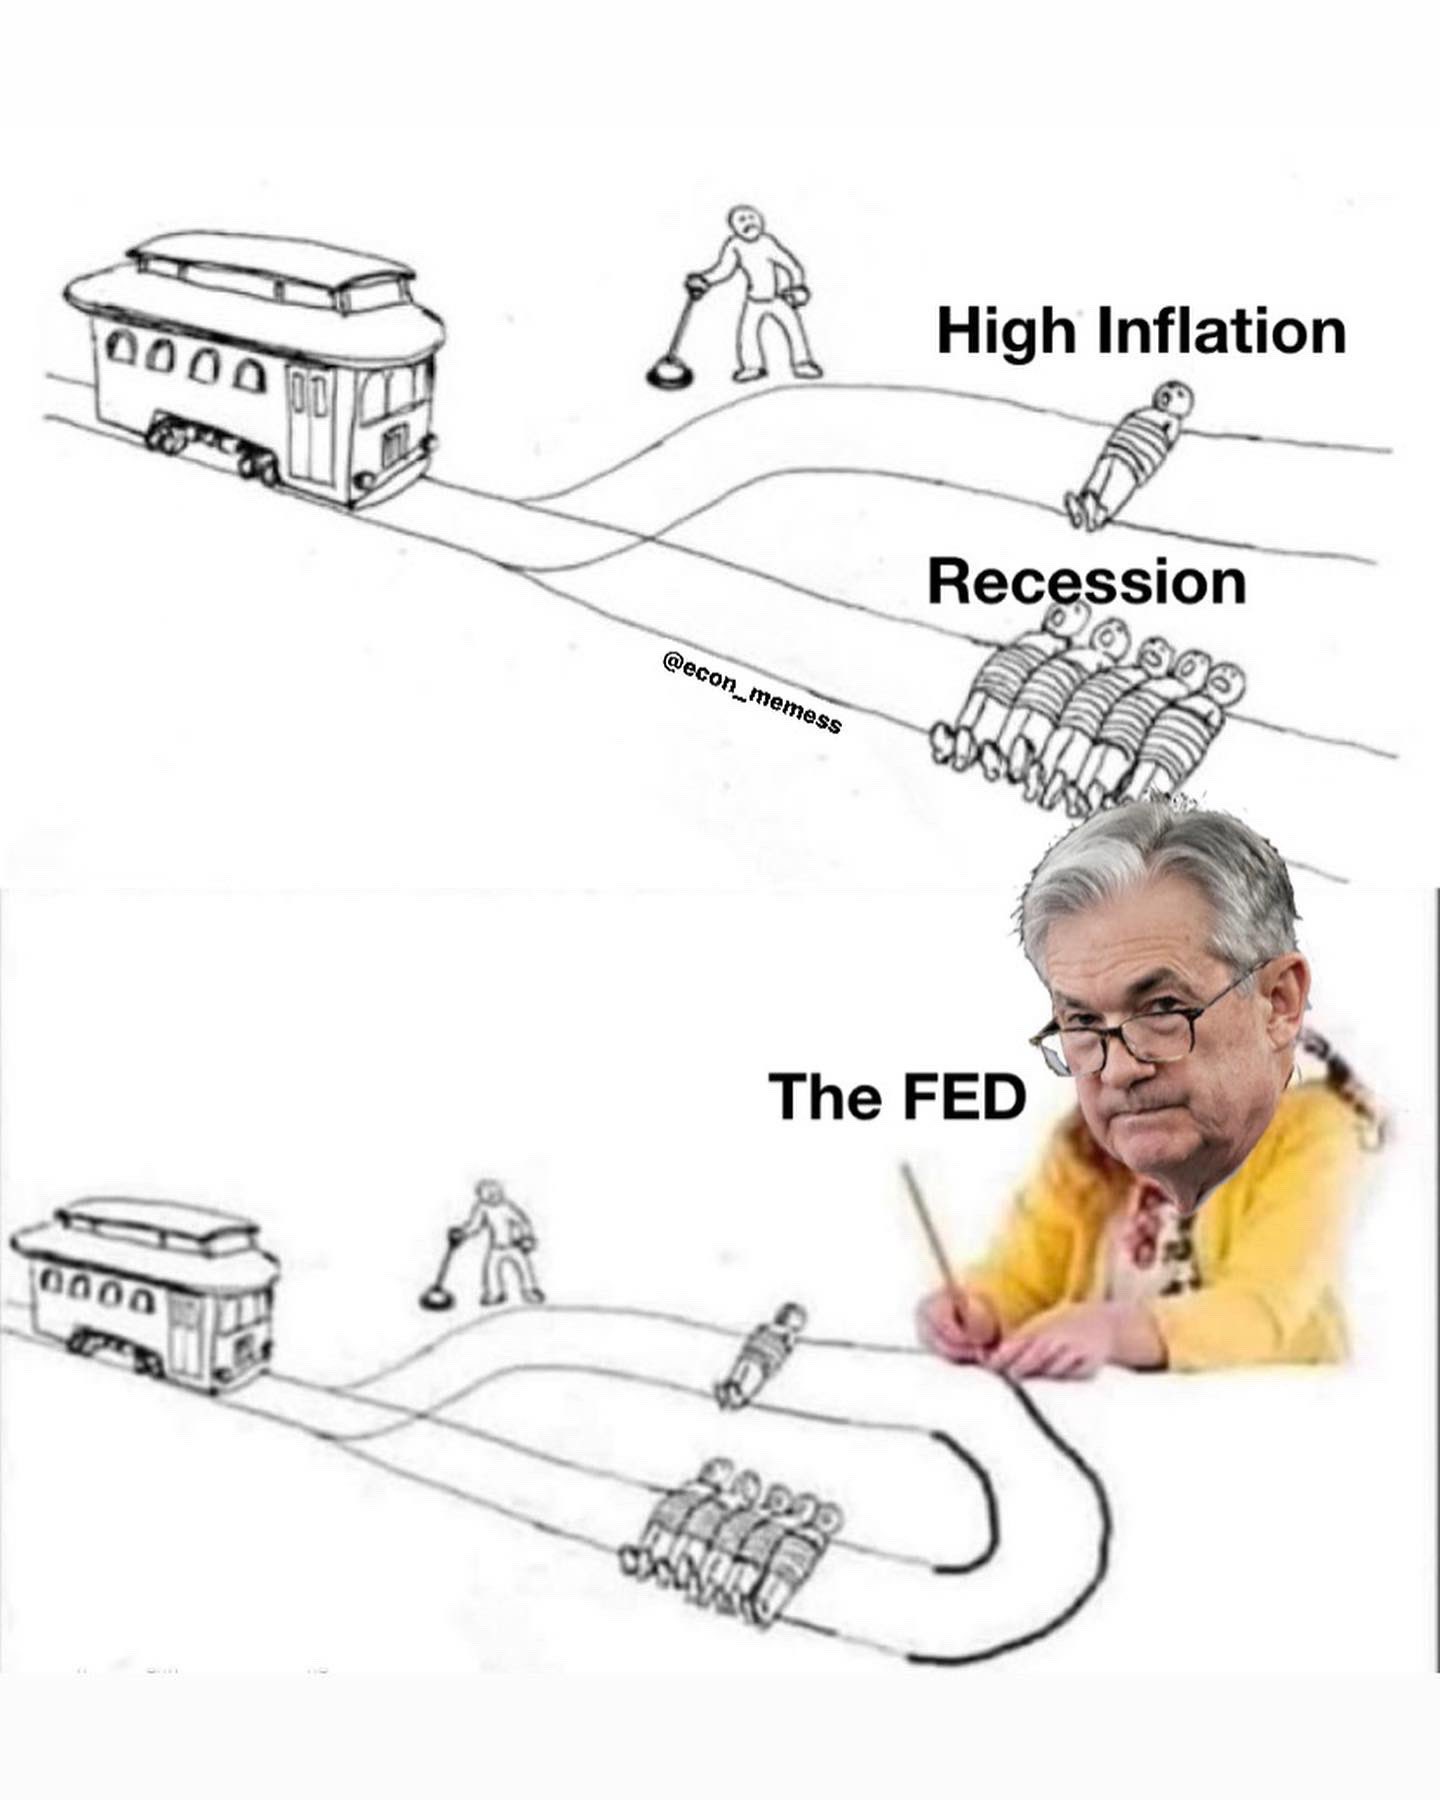
The idea actually goes along well with the old saying: "DON'T FIGHT THE FED" because it was Jerome Powell that told us they FED was going to raise rates that they we would be feeling PAIN.

What is pain in this perspective, well it probably means job losses.....and along that path there will be the inflation stripping away purchasing power as we get there.

 Today's market prices seem to be increasing, but yesterday's market slide was pretty horrible after the much higher than expected declines. 

DEFENSE is the word of the day..... (SO: "Don't buy the dip....wait....then, buy the Train Wreck!")


Sunday, September 04, 2022

EVER WONDER WHO RECEIVED PPP LOANS AND HOW MUCH?

 SOMEONE POINTED ME AT TWO WEBSITES THAT LISTS PPP LOAN HOLDERS

We all know that many of not all PPP loans were forgiven, and I think we have all heard of companies that "cheated" and taken loans when they should not have. I'm not suggesting that most were bogus, in fact the government shutting down everything required something like this to happen. (in hindsight, that might all have been a mistake, but that's bot the thing I am writing about here)

So the first website is one that lists total PPP loans for each company....in this case, I had it list all companies in North Conway. 

https://pppreport.org/advanced.php?business=&address=&city=North+Conway&state=NH&zip=&naics=selected&naicscode=&businesstype=selected&race=selected&gender=selected&veteran=selected&nonprofit=selected&jobs=selected&cd=selected&loanamt=selected


The second website is similar, but lists each individual loans....so you will see that some companies took out several PPP loans. (Again, the list shown in the link below if for North Conway, NH....but you can research with your own parameters)

https://ppp-loan.info/?BorrowerName=&BorrowerState=NH&BorrowerCity=North%20Conway


Saturday, September 03, 2022

YIELD CURVE INVERSIONS....THEY ARE A REGULAR THINGS THESE DAYS.... (OUCH!)


WHAT ARE YIELD CURVE INVERSIONS?

Simply put, the cost of borrowing money generally goes up the longer the loan is...that is, the lender is taking on all kinds of extra risk over that longer time. So interest rates on longer term loans are typically higher than those on shorter term loans.....and bond are just debt instruments, a lender contract with a borrower.

So it is quite normal for say a 30 year bond to have a higher interest rate than a 20 year bond, which is higher than a 2 year bond and so forth.

A yield curve inversion exists when the shorter term bonds have a higher interest rate than the longer term bonds.

Here is a Wikipedia article on yield curves: https://www.investopedia.com/terms/i/invertedyieldcurve.asp


HOW ARE THE YIELD CURVES PRESENTLY?

Well, they are significantly inverted, and have been for a bit as of late. But this isn't the first time in recent history they have been inverted......I track the yield curves with a spreadsheet, and I saw them inverting early this year.

Here is my spreadsheet showing the current inversion:


The square that I have hilighted is what is known as the 2's/10's calculation.....a comparison of the 10 year rate and the 2 year rate...this is the relationship that most focus in on....I understand the Federal Reserve focuses in on the comparing the 10 year and the 1 year, smoothed with a 3 month moving average.

Here is an example from the FED Website.....albeit older:


SO WHAT DOES THIS SIGNAL?

It is a reliable signal of recession.....roughly 6 to 18 months after the inversion. So the inversion earlier this year could have been a sign of our being in a recession right now! We shall see how the government office that calls these things feels before the elections I guess. Bit either way, we are getting some heavy duty inversion right now.....so IMHO, if we are not in recession currently, we will be in short order.

Here is another article that talks about how & why inversions have predictive power: https://www.unionbank.com/private-banking/perspectives/market-economic-outlook/inverted-yield-curve-explained


HOW ABOUT OTHER COUNTRIES AND THEIR YIELD CURVES?

Well, I am not sure how predictive this is in other countries, but it seems to me the general concept should generally apply.....so here is a list of countries with inverted yield curves as I type this. (This week)


Also, here is the article that the above graph was sourced from.   http://www.worldgovernmentbonds.com/inverted-yield-curves/


WHAT TO DO?

I just suggest you prepare for a recession.....and in this case, perhaps an inflationary one. (whether inflation is high or lower, I suspect it will be higher than any wage / benefit increases we will be seeing because of the slowing economy)

So perhaps be UBER careful with debt.....in fact, try to get out from under it unless it is long term with low rates. Try to save money for that rainy day....the one you might see with a job / benefits loss. Also, get your cash flow under control.....spending down, saving up. (I wouldn't just make a plan for it, I would kick that plan into action and get ahead of it)


Friday, September 02, 2022

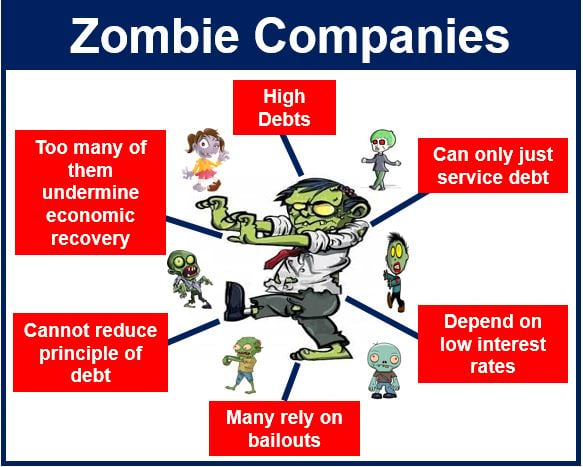
Interest Rates Going Up.....Costs (Inflation) Going Up......Next Thing To Watch, Zombie Companies!


WHAT IS A ZOMBIE COMPANY?

This is how Investopedia defines a Zombie Company....."What Are Zombies? Zombies are companies that earn just enough money to continue operating and service debt but are unable to pay off their debt. Such companies, given that they just scrape by meeting overheads (wages, rent, interest payments on debt, for example), have no excess capital to invest to spur growth." ( https://www.investopedia.com/terms/z/zombies.asp )


WHY WORRY NOW?

Well, first we are talking about supporting debt....that means the company is going to be rolling over debt at ever increasing interest rates. The debt costs for them will be rising!

Second, the inflation we have been seeing is pushing up input costs for everyone, including these Zombies.....so as the definition describes them of barely having the money to continue on as a going concern, so rising input costs can't be a good thing. If they had better pricing power in their industry, they would NOT be running their company so close to losing money.....increasing input costs can only hurt their cash flow.

Oh, and the slowing economy only applies pressure to their incoming revenue stream...their customers will likely diminish and so they will see pressure on their money flows coming in. 

These three things don't guarantee failure, but they surely apply negative pressure to EVERY company, and so those are are so close to failure might well step "over the edge" and so fail.


HOW DID I COME TO THINK ABOUT ZOMBIES?

Well, the conversation about zombie companies have gone on for the longest time when we went through not only the DOT COM crisis and then the housing crisis. Not just US companies, there are many all across the world, but the lost interest environment has allowed these companies to take on more and more debt to keep their operations going.....as interest rates go down, they can take out more debt at the same cost....they can "kick their debt problems down the road". Increasing interest rates have the opposite affect.

So I came to think about this again when I came across several articles....and this first one has a pretty good analysis of current times / situation.


HOW DOES ONE FIND ZOMBIES?

Well, first I suppose it makes sense to look at what others feel to be Zombie companies....here is one list: https://finbox.com/ideas/zombie-companies-list

Then I think we each need to be able to look at a companies balance sheet and cash flow statements to see how they keep their company afloat....whether their actual business was enough to keep their "lights on". One thing that you might find in a zombie is their need to continuously add debt in order to continues existence....debt without say growth or productive capacity increases.....but the other thing you might find is a company that is "hollowing itself out" by needing to sell of assets in order to keep the money coming in so they can keep the lights on.....but if the sales of those assets is resulting in them lowering their productive capacity (which will ultimately lower revenues in the future.....that is a bad recipe for a downward spiral)


WHAT NEXT?

I suppose I need to add this to the analysis of the stocks I have in my 401K investment.....I tend to look a lot at their dividend cash flow, and the general health of the balance sheet....but I other than total debt and things like Quick Ratio and Current Ratio, but I need to look closer at their debt trajectory. (and figure out how to do that easily)